


When writing an equation from a table, the first step is to identify the independent variable (x) and the dependent variable (y). The independent variable is the variable that changes and the dependent variable is the variable that is affected by the change in the independent variable. The values of the dependent variable are determined by the values of the independent variable.
For example, if the table shows a relationship between time (x) and distance (y), the equation can be written as:
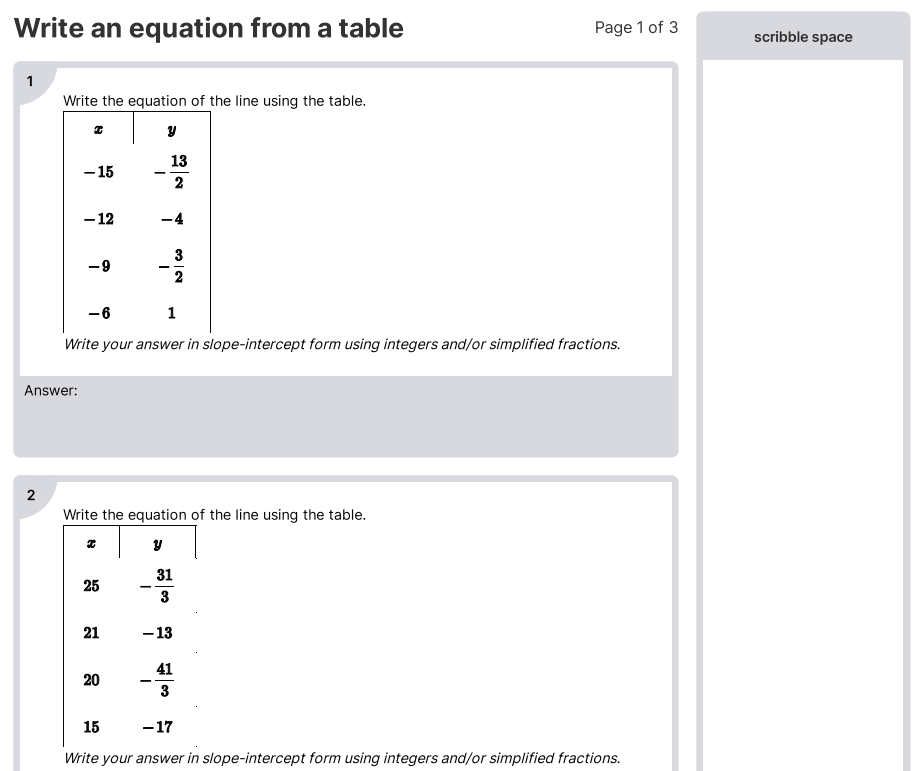
y = mx + b
Where m is the slope (rate of change) and b is the y-intercept (the value of y when x = 0)
The slope is calculated by finding the ratio of the change in the y-coordinate to the change in the x-coordinate between two points on the table, m = (y2 - y1) / (x2 - x1)
The y-intercept is determined by finding the value of y when x = 0, b = y1 - m*x1
Once you have the slope and y-intercept, you can substitute these values into the equation and you have the equation that represents the relationship between the variables in the table.
It is important to note that, the equation you get from the table is an equation of a linear function, which means that the relationship between the variables is a straight line.
Teaching Write An Equation From A Table Easily
- Using real-world examples: Provide students with real-world examples of tables that show a relationship between variables, such as in science experiments, engineering or economics. This can help students understand the concept and apply it to new situations.
- Guided practice: Provide students with guided practice problems that involve writing an equation from a table. Start with simple examples and gradually increase the difficulty level.
Why Should You Use Write an equation from a table Worksheet for your students?
- Practice and reinforcement: Worksheets provide an opportunity for students to practice and reinforce the concept of finding the slope of a proportional relationship.
- Self-paced learning: Worksheets allow students to work at their own pace and level, which can be helpful for students who may need more practice or who may be working at a faster pace than their peers.
- Reviewing material: Worksheets can be used to review material covered in class and to prepare for assessments.
Download Write an equation from a table Worksheets PDF
You can download and print these super fun write an equation from a table 8th grade pdf from here for your students. You can also try our Write An Equation From A Table Problems and Write An Equation From A Table Quiz as well for a better understanding of the concepts.