Create A Graph To Match Inequality Worksheet

8 problems

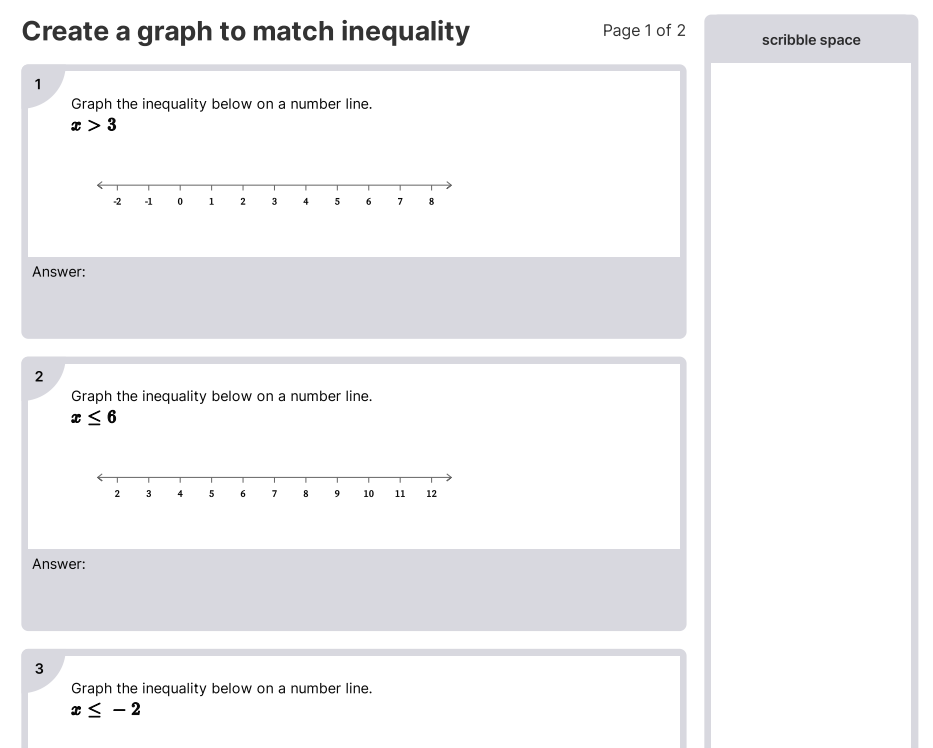
Create a graph to match inequality worksheet is designed to help grade 6 students master this critical skill. Students first understand what inequality is. An inequality is a mathematical statement that contains a symbol such as <, >, ≤, or ≥. 


For example, 2x + 3 < 7 is an inequality where 2x + 3 is compared to 7 using the symbol <. To graph an inequality, students must first identify the variables involved in the inequality such as x or y. 


Once the variables are identified, students must shade the area of the graph that satisfies the inequality. The shaded area represents all the possible values that the variables can take to satisfy the inequality.
 

Grade 6
Expressions, Equations, And Inequalities
6.EE.B.8

For example: Graph the inequality 2x + 3 < 7.


Solution:


To graph this inequality, we start by plotting the line 2x + 3 = 7 on the x-y plane. 
Next, we shade the area below the line because all the points below the line satisfy the inequality 2x + 3 < 7.


Therefore, the graph of the inequality is shown below.

What teachers are saying about BytelearnWhat teachers are saying

stephan.png
Stephen Abate
19-year math teacher
Carmel, CA
Any math teacher that I know would love to have access to ByteLearn.
jennifer.png
Jennifer Maschino
4-year math teacher
Summerville, SC
“I love that ByteLearn helps reduce a teacher’s workload and engages students through an interactive digital interface.”
rodolpho.png
Rodolpho Loureiro
Dean, math program manager, principal
Miami, FL
“ByteLearn provides instant, customized feedback for students—a game-changer to the educational landscape.”