


Write the Equation for a Proportional Relationship Lesson Plan
Overview
In this lesson, students will learn how to write the equation for a proportional relationship. Students will begin by discussing a verbal description. Then, students will relate the problem to writing an equation. Students will go through writing an equation for tables, verbal descriptions, and graphs. You can expect this lesson with additional practice to take one `45`-minute class period.
ByteLearn gives students targeted feedback and hints based on their specific mistakes
Preview step-by-step-help
Objective
Students will be able to write the equation for a proportional relationship.
Materials
- Teacher Slideshow
- Online Practice
How to Teach Writing the Equation for a Proportional Relationship
Overall flow of the lesson
You will first look at writing an equation for a proportional relationship from a table and a simple problem with time and distance. Students will write an equation without using any variables.
You will then introduce the equation `y= kx` and discuss how to write an equation in this form. We will discuss an alternate way of writing an equation that works better for some students.
From then on, students will look at writing equations from a graph and a verbal description.
Warm-up
Start the lesson by presenting a proportional relationship given in a table. You will deliberately keep variables out of the situation. You are asking students to write an equation using the labels “time” and “distance”.


Copy these Google Slides for free
Students will state various ways in which they recognize that this is a proportional relationship - most likely students will see that when you divide left by right, you always get `5` and the other way around.
Explore ways to write an equation
Students might write an equation in many different ways:
- distance `\div` time `= 5`
- distance `\div 5=` time
- time `\times 5 =` distance
- `\frac{1}{5}\times ` distance `=` time
Tell students that we can check if an equation is correct by plugging in a few values from the table. You might want to reinforce this every time they write an equation from hence on.
Independent and dependent variables
Students would have already looked at independent and dependent variables. Review these concepts in the context of this problem. Students might give different reasons for why time or distance is an independent variable.
Introduce `y=kx`
Tell students that while there are various different ways you can write an equation to represent a proportional relationship, there is a standard form that is associated with a proportional relationship.

Ask students to use their words to describe this equation. The broad idea is that you do something to `x` to get `y` - in a proportional relationship, you basically multiply by the constant of proportionality.
Confusion between `y=kx` and `k=\frac{y}{x}`
Students would already know by now about the formula for constant of proportionality. They might confuse the two formulas and write the equation as `k = yx`. You have to remind them `k` is the ratio of `y` to `x`. You should also talk about the relationship between these two equations - how one is derived from the other.
What works and does not work while writing an equation?
When variables are not given as `x` and `y`, it becomes quite confusing for students. One common mistake that students make is to find the constant of proportionality but not be consistent with the use of independent and dependent variable while writing the equation.
For example when `t = 10` and `d = 2`, they might find the constant of proportionality as `5 (10 \div 2)`, but then write the equation as `d = 5t`.
Another classic error is to write the equation as `10t = 2d`.
Sometimes students write the equation as `t/d = 10/2 = 5` which is a valid equation. If students want to write the equation this way, you want to ask them how you can have the `t` by itself. Since `t` is being divided by `d`, you can multiply by `d` to get rid of the `d`.
Process for writing an equation for a proportional relationship
It is best for students to use their common sense or a strategy that works for them to write an equation for a proportional relationship. Encourage them to check whether their equation makes sense by substituting values of the variables.
Here is a process that students can follow as reference in case they are stuck:
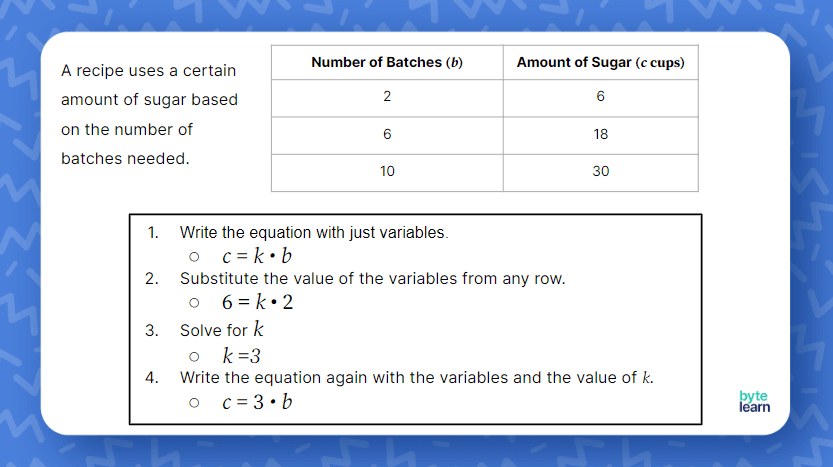
It may also be helpful to show how multiplying the number of batches by `3` for each row helps to find the amount of sugar.
Equation for a proportional relationship from a verbal description
Writing an equation from a verbal description is very similar to how you would write an equation from a table. However, since the data is not as organized, encourage students to first write down the given values for the variables.

Equation for a proportional relationship from a graph
Next, present a problem where the proportional relationship is represented in a graph.

With the given graph, remind students that they will need to determine the constant of proportionality to write the equation for the proportional relationship. Some students will immediately recall that they need to pick a lattice point and divide the `y`-value by the `x`-value; therefore, it may be beneficial to allow students time to work together to write the equation for the proportional relationship.
Summarize what they have learned
This is a good time to allow students to reflect on what they have covered. Did they prefer descriptions, tables, or graphs? What method worked the best for them? Because there are multiple ways for the questions to be asked, it would be beneficial to also have students make connections between the three different forms that they will work with to write the equation for a proportional relationship.
Writing two equations for a proportional relationship
As an extension, you might want to ask students to write two equations for the same relationship - each starting with a different variable.

It will be great for students to see that you can write the equation as `d = 20g` or `g = 1/20 d`. If you do more of these problems, students will notice that when they switch the variables, the coefficients of `x` (the constant of proportionality) are reciprocals.
Write the Equation for a Proportional Relationship Practice
After you’ve completed the examples with the whole class, it’s time for some independent practice! ByteLearn gives you access to tons of mild, medium, and spicy practice problems for writing an equation for a proportional relationship. Check out the online practice and assign to your students for classwork and/or homework!


View this practice