Worksheet

Read And Interpret Histograms Worksheet

7 problems

In grade 6 math the Histograms represents discrete or continuous data over an interval, typically represented by bars on a graph. Histograms are used to show the shape, center, and spread of the data set. A histogram consists of a series of adjacent rectangles or bars that are used to represent the frequency or relative frequency of data within a particular range. 


The height of each bar represents the frequency or relative frequency of the data set. Teachers can provide Read and Interpret Histograms Worksheet, to their students to improve their skills in analyzing data sets using histograms.

Grade 6
Statistics
6.SP.B.4

For example: John recorded the number of houses that were decorated with holiday lights on different blocks in his neighborhood.


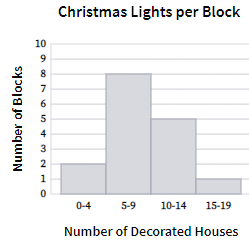
Which was the most common interval for the number of decorated houses?


Solution:


From the above histogram...

Show all

What teachers are saying about BytelearnWhat teachers are saying

stephan.png
Stephen Abate
19-year math teacher
Carmel, CA
Any math teacher that I know would love to have access to ByteLearn.
jennifer.png
Jennifer Maschino
4-year math teacher
Summerville, SC
“I love that ByteLearn helps reduce a teacher’s workload and engages students through an interactive digital interface.”
rodolpho.png
Rodolpho Loureiro
Dean, math program manager, principal
Miami, FL
“ByteLearn provides instant, customized feedback for students—a game-changer to the educational landscape.”