


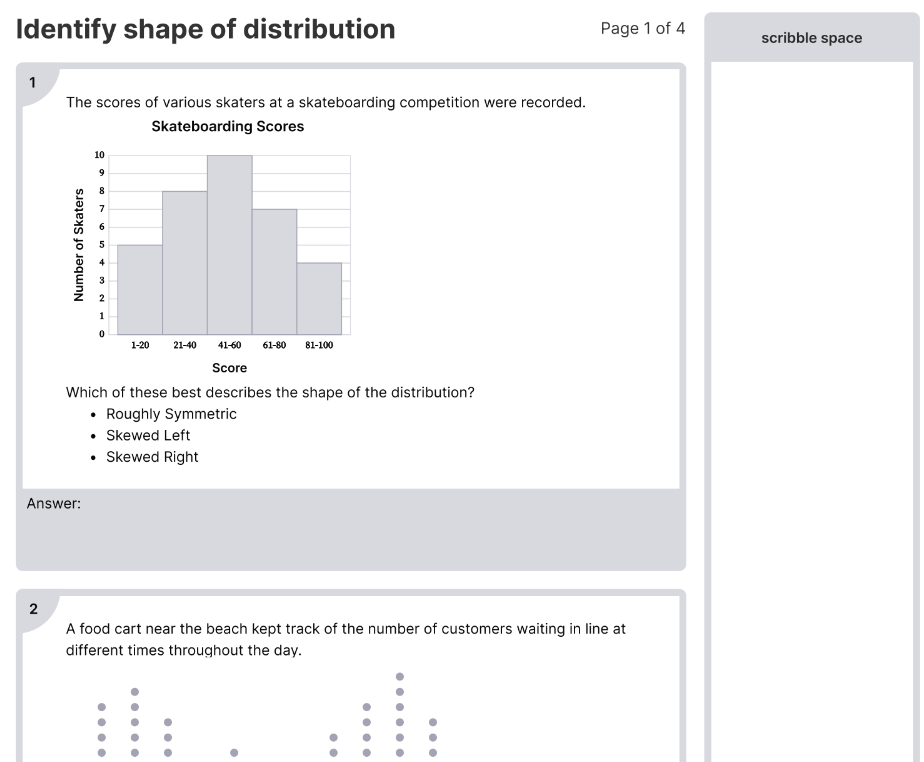


The above worksheet includes a set of data and students have to identify the shape of the distribution based on its characteristics. For example, a typical question on an identify shape of distribution worksheet might ask students to identify whether a distribution is symmetrical, skewed left, or skewed right. To help students better understand this concept, math teachers may use the above worksheet.
Identify Shape Of Distribution Worksheet
Do you want to see how your students perform in this assignment?
50,000+ teachers over use Byte!
Create your unique worksheets
-
 Add Differentiated practice to your worksheets
 - Track your student’s performance
- Identify and fill knowledge gaps

About Worksheet
Grade 6
Statistics
6.SP.A.2
In grade 6 statistics, shape of a distribution refers to the way that data points are distributed in relation to the mean, median, and mode. This can have important implications for understanding trends and patterns in data sets, as well as for making predictions and drawing conclusions based on the data. By using this worksheet, math teachers can help students to develop a deeper understanding of statistical concepts and their applications in real-world scenarios.
50,000+ teachers over the world use Byte!
Digitally assign and customise your worksheet using AI
- Add Differentiated practice to your worksheets
- See how your class performs
- Identify and fill knowledge gaps