

AI tutor


Welcome to Bytelearn!
Let’s check out your problem:
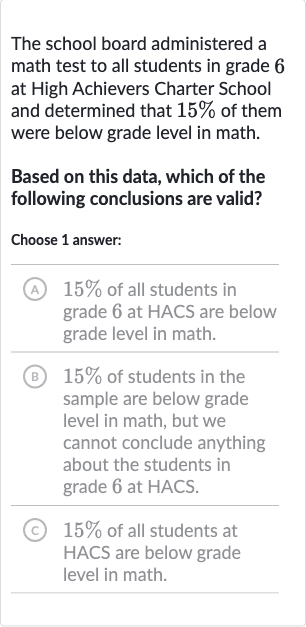
The school board administered a math test to all students in grade at High Achievers Charter School and determined that of them were below grade level in math.Based on this data, which of the following conclusions are valid?Choose answer:(A) of all students in grade at HACS are below grade level in math.(B) of students in the sample are below grade level in math, but we cannot conclude anything about the students in grade at HACS.(C) of all students at HACS are below grade level in math.


Full solution
Q. The school board administered a math test to all students in grade at High Achievers Charter School and determined that of them were below grade level in math.Based on this data, which of the following conclusions are valid?Choose answer:(A) of all students in grade at HACS are below grade level in math.(B) of students in the sample are below grade level in math, but we cannot conclude anything about the students in grade at HACS.(C) of all students at HACS are below grade level in math.
- Read Carefully: Read the problem statement carefully to understand what data is given and what needs to be concluded.
- Identify Percentage: Identify the given percentage: of students in grade at HACS are below grade level in math.
- Analyze Options: Analyze the options to find which one correctly interprets the given data.
- Evaluate Option (A): Option (A) states that of all students in grade at HACS are below grade level in math, which matches the information given in the problem statement.
- Evaluate Option (B): Option (B) suggests that we cannot conclude anything about the students in grade at HACS based on the sample, but this contradicts the information provided as the data is said to be about all students in grade .
- Evaluate Option (C): Option (C) claims that of all students at HACS are below grade level in math, which is too broad since the data is specifically about grade students, not the entire school.
- Choose Correct Answer: Choose the correct answer based on the analysis of the options.
More problems from Interpret confidence intervals for population means
QuestionGet tutor help

QuestionGet tutor help
QuestionGet tutor help
QuestionGet tutor help
QuestionGet tutor help
QuestionGet tutor help
QuestionGet tutor help
QuestionGet tutor help
QuestionGet tutor help
QuestionGet tutor help