

AI tutor


Welcome to Bytelearn!
Let’s check out your problem:
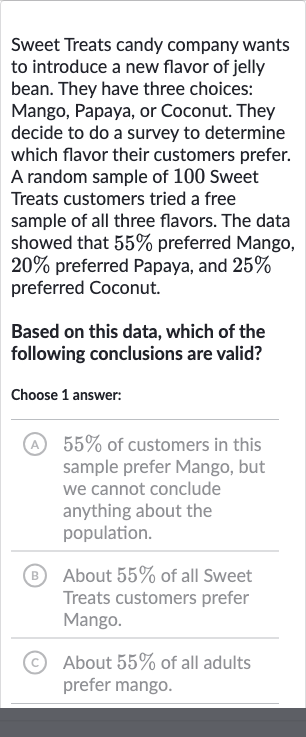
Sweet Treats candy company wants to introduce a new flavor of jelly bean. They have three choices: Mango, Papaya, or Coconut. They decide to do a survey to determine which flavor their customers prefer. A random sample of Sweet Treats customers tried a free sample of all three flavors. The data showed that preferred Mango, preferred Papaya, and preferred Coconut.Based on this data, which of the following conclusions are valid?Choose answer:(A) of customers in this sample prefer Mango, but we cannot conclude anything about the population.(B) About of all Sweet Treats customers prefer Mango.(C) About of all adults prefer mango.


Full solution
Q. Sweet Treats candy company wants to introduce a new flavor of jelly bean. They have three choices: Mango, Papaya, or Coconut. They decide to do a survey to determine which flavor their customers prefer. A random sample of Sweet Treats customers tried a free sample of all three flavors. The data showed that preferred Mango, preferred Papaya, and preferred Coconut.Based on this data, which of the following conclusions are valid?Choose answer:(A) of customers in this sample prefer Mango, but we cannot conclude anything about the population.(B) About of all Sweet Treats customers prefer Mango.(C) About of all adults prefer mango.
- Question Prompt: Question_prompt: Determine which conclusion is valid based on the survey data from Sweet Treats candy company.
- Calculate Percentages: Calculate the percentage of customers who preferred each flavor.Mango: Papaya: Coconut:
- Analyze Options: Analyze the options given:A) of customers in this sample prefer Mango, but we cannot conclude anything about the population.B) About of all Sweet Treats customers prefer Mango.C) About of all adults prefer mango.
- Consider Sample Data: Understand that the data is from a sample of customers, not the entire population of Sweet Treats customers or all adults.
- Recognize Limitations: Recognize that we can't make conclusions about the entire population or all adults based on a sample.
- Choose Correct Answer: Choose the correct answer based on the analysis.The correct answer is A) of customers in this sample prefer Mango, but we cannot conclude anything about the population.
More problems from Interpret confidence intervals for population means
QuestionGet tutor help

QuestionGet tutor help
QuestionGet tutor help
QuestionGet tutor help
QuestionGet tutor help
QuestionGet tutor help
QuestionGet tutor help
QuestionGet tutor help
QuestionGet tutor help
QuestionGet tutor help