AI tutor
Welcome to Bytelearn!
Let’s check out your problem:

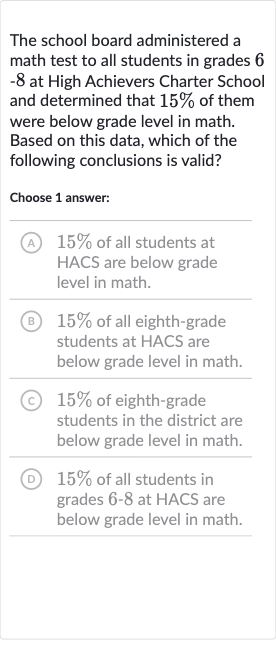
The school board administered a math test to all students in grades at High Achievers Charter School and determined that of them were below grade level in math. Based on this data, which of the following conclusions is valid?Choose answer:(A) of all students at HACS are below grade level in math.(B) of all eighth-grade students at HACS are below grade level in math.(C) of eighth-grade students in the district are below grade level in math.(D) of all students in grades at HACS are below grade level in math.
Full solution
Q. The school board administered a math test to all students in grades at High Achievers Charter School and determined that of them were below grade level in math. Based on this data, which of the following conclusions is valid?Choose answer:(A) of all students at HACS are below grade level in math.(B) of all eighth-grade students at HACS are below grade level in math.(C) of eighth-grade students in the district are below grade level in math.(D) of all students in grades at HACS are below grade level in math.
- Understand Information: Analyze the given information and understand what the represents.The problem states that of students in grades - at High Achievers Charter School (HACS) are below grade level in math. This percentage is specific to the school and the grades mentioned.
- Evaluate Answer Choices: Evaluate each answer choice to determine which one accurately reflects the given data.(A) This choice is too broad because it includes all students at HACS, not just those in grades .
- Continue Evaluating: Continue evaluating the answer choices.(B) This choice is too narrow because it specifies only eighth-grade students, whereas the data is about students in grades .
- Assess Last Choice: Keep evaluating the answer choices.(C) This choice is incorrect because it extends the conclusion to the entire district, which is not supported by the data provided.
- Assess Last Choice: Keep evaluating the answer choices.(C) This choice is incorrect because it extends the conclusion to the entire district, which is not supported by the data provided.Assess the last answer choice.(D) This choice correctly reflects the data given, as it specifies that of all students in grades at HACS are below grade level in math, which is exactly what the data indicates.
More problems from One-step inequalities: word problems
QuestionGet tutor help
QuestionGet tutor help
QuestionGet tutor help
QuestionGet tutor help
QuestionGet tutor help
QuestionGet tutor help
QuestionGet tutor help
QuestionGet tutor help
QuestionGet tutor help
QuestionGet tutor help
