

AI tutor


Welcome to Bytelearn!
Let’s check out your problem:
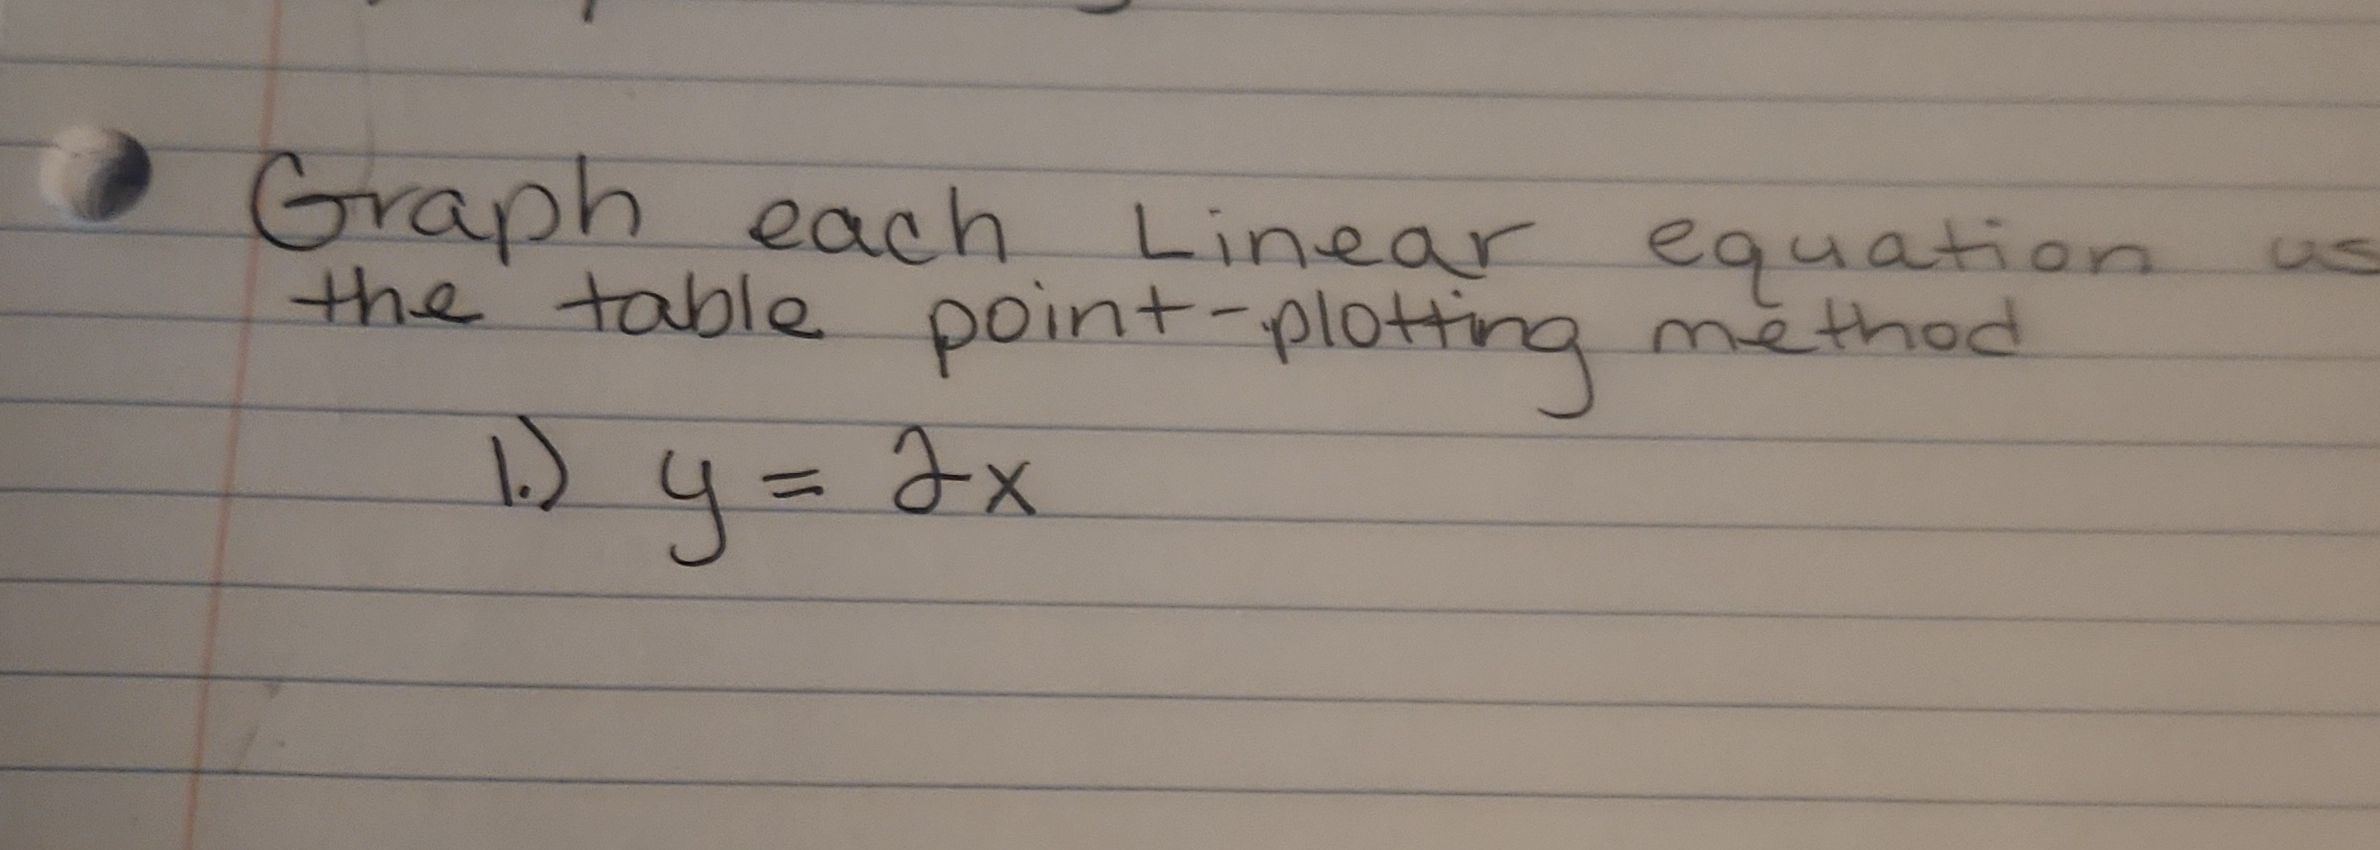
Graph each Linear equation the table point-plotting method.)


Full solution
Q. Graph each Linear equation the table point-plotting method.)
- Identify Equation Type: Identify the type of the equation.The given equation is a linear equation in slope-intercept form, where the slope () is and the y-intercept () is .
- Create Table of Values: Create a table of values.Choose values for and calculate the corresponding values using the equation . Let's choose values of , , , , and .
- Calculate Y Values: Calculate the y values.For : For : For : For : For :
- Plot Points on Graph: Plot the points on a graph. Plot the points , , , , and on the coordinate plane.
- Draw Line: Draw the line.Connect the points with a straight line, which extends infinitely in both directions. This line represents all the solutions to the equation .
More problems from Describe the graph of a linear equation

QuestionGet tutor help
QuestionGet tutor help
QuestionGet tutor help
QuestionGet tutor help
QuestionGet tutor help
QuestionGet tutor help
QuestionGet tutor help