

AI tutor


Welcome to Bytelearn!
Let’s check out your problem:
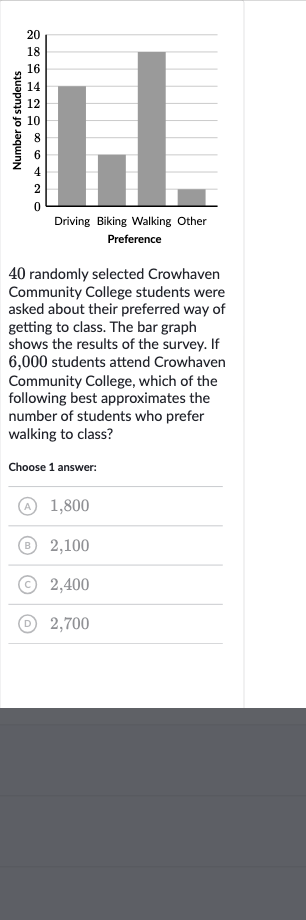
randomly selected Crowhaven Community College students were asked about their preferred way of getting to class. The bar graph shows the results of the survey. If , students attend Crowhaven Community College, which of the following best approximates the number of students who prefer walking to class?Choose answer:(A) ,(B) ,(C) ,(D) ,


Full solution
Q. randomly selected Crowhaven Community College students were asked about their preferred way of getting to class. The bar graph shows the results of the survey. If , students attend Crowhaven Community College, which of the following best approximates the number of students who prefer walking to class?Choose answer:(A) ,(B) ,(C) ,(D) ,
- Understand the given data: First, we need to understand the data given in the bar graph. Since the bar graph is not provided, we will assume that the percentage of students who prefer walking is given in the graph. Let's say the bar graph indicates that a certain percentage of the students surveyed prefer walking. We need to find that percentage to calculate the approximate number of all students who prefer walking.
- Calculate percentage of surveyed students: Next, we need to calculate the percentage of the surveyed students who prefer walking. If the bar graph shows, for example, that out of the students prefer walking, then the percentage is .
- Estimate percentage using answer choices: However, since the bar graph is not provided, we cannot calculate the exact percentage. Therefore, we must rely on the answer choices to estimate the percentage. We will use the answer choices to reverse-engineer the percentage of students who prefer walking.
- Check for whole number result: Let's assume that the answer choice (A) is correct. To find the percentage this represents of the total student population, we calculate .
- Repeat process for each answer choice: Performing the calculation gives us .
- Determine possible values on the bar graph: Now, we need to check if of the surveyed students is a whole number since we can't have a fraction of a person. of is .
- Unable to proceed without bar graph data: Calculating of gives us . This means that if is the correct number of students who prefer walking, then out of the surveyed students would have indicated walking as their preference.
- Unable to proceed without bar graph data: Calculating of gives us . This means that if is the correct number of students who prefer walking, then out of the surveyed students would have indicated walking as their preference.We need to repeat this process for each answer choice to see which one gives us a whole number when calculating the percentage of the surveyed students. If none of the answer choices result in a whole number, we would need to reassess our approach or get more information from the bar graph.
- Unable to proceed without bar graph data: Calculating of gives us . This means that if is the correct number of students who prefer walking, then out of the surveyed students would have indicated walking as their preference.We need to repeat this process for each answer choice to see which one gives us a whole number when calculating the percentage of the surveyed students. If none of the answer choices result in a whole number, we would need to reassess our approach or get more information from the bar graph.For answer choice (B) , we calculate . Then, of is .
- Unable to proceed without bar graph data: Calculating of gives us . This means that if is the correct number of students who prefer walking, then out of the surveyed students would have indicated walking as their preference. We need to repeat this process for each answer choice to see which one gives us a whole number when calculating the percentage of the surveyed students. If none of the answer choices result in a whole number, we would need to reassess our approach or get more information from the bar graph. For answer choice (B) , we calculate . Then, of is . Calculating of gives us . This means that if is the correct number of students who prefer walking, then out of the surveyed students would have indicated walking as their preference.
- Unable to proceed without bar graph data: Calculating of gives us . This means that if is the correct number of students who prefer walking, then out of the surveyed students would have indicated walking as their preference.We need to repeat this process for each answer choice to see which one gives us a whole number when calculating the percentage of the surveyed students. If none of the answer choices result in a whole number, we would need to reassess our approach or get more information from the bar graph.For answer choice (B) , we calculate . Then, of is .Calculating of gives us . This means that if is the correct number of students who prefer walking, then out of the surveyed students would have indicated walking as their preference.For answer choice (C) , we calculate . Then, of is .
- Unable to proceed without bar graph data: Calculating of gives us . This means that if is the correct number of students who prefer walking, then out of the surveyed students would have indicated walking as their preference.We need to repeat this process for each answer choice to see which one gives us a whole number when calculating the percentage of the surveyed students. If none of the answer choices result in a whole number, we would need to reassess our approach or get more information from the bar graph.For answer choice (B) , we calculate . Then, of is .Calculating of gives us . This means that if is the correct number of students who prefer walking, then out of the surveyed students would have indicated walking as their preference.For answer choice (C) , we calculate . Then, of is .Calculating of gives us . This means that if is the correct number of students who prefer walking, then out of the surveyed students would have indicated walking as their preference.
- Unable to proceed without bar graph data: Calculating of gives us . This means that if is the correct number of students who prefer walking, then out of the surveyed students would have indicated walking as their preference. We need to repeat this process for each answer choice to see which one gives us a whole number when calculating the percentage of the surveyed students. If none of the answer choices result in a whole number, we would need to reassess our approach or get more information from the bar graph. For answer choice (B) , we calculate . Then, of is . Calculating of gives us . This means that if is the correct number of students who prefer walking, then out of the surveyed students would have indicated walking as their preference. For answer choice (C) , we calculate . Then, of is . Calculating of gives us . This means that if is the correct number of students who prefer walking, then out of the surveyed students would have indicated walking as their preference. For answer choice (D) , we calculate . Then, of is .
- Unable to proceed without bar graph data: Calculating of gives us . This means that if is the correct number of students who prefer walking, then out of the surveyed students would have indicated walking as their preference. We need to repeat this process for each answer choice to see which one gives us a whole number when calculating the percentage of the surveyed students. If none of the answer choices result in a whole number, we would need to reassess our approach or get more information from the bar graph. For answer choice (B) , we calculate . Then, of is . Calculating of gives us . This means that if is the correct number of students who prefer walking, then out of the surveyed students would have indicated walking as their preference. For answer choice (C) , we calculate . Then, of is . Calculating of gives us . This means that if is the correct number of students who prefer walking, then out of the surveyed students would have indicated walking as their preference. For answer choice (D) , we calculate . Then, of is . Calculating of gives us . This means that if is the correct number of students who prefer walking, then out of the surveyed students would have indicated walking as their preference.
- Unable to proceed without bar graph data: Calculating of gives us . This means that if is the correct number of students who prefer walking, then out of the surveyed students would have indicated walking as their preference.We need to repeat this process for each answer choice to see which one gives us a whole number when calculating the percentage of the surveyed students. If none of the answer choices result in a whole number, we would need to reassess our approach or get more information from the bar graph.For answer choice (B) , we calculate . Then, of is .Calculating of gives us . This means that if is the correct number of students who prefer walking, then out of the surveyed students would have indicated walking as their preference.For answer choice (C) , we calculate . Then, of is .Calculating of gives us . This means that if is the correct number of students who prefer walking, then out of the surveyed students would have indicated walking as their preference.For answer choice (D) , we calculate . Then, of is .Calculating of gives us . This means that if is the correct number of students who prefer walking, then out of the surveyed students would have indicated walking as their preference.Now, we need to determine which of these whole numbers (, , , ) could be represented on the bar graph. Since we don't have the bar graph, we cannot make a definitive conclusion. However, we can say that each of these answer choices could be possible if the corresponding number of students from the survey preferred walking.
- Unable to proceed without bar graph data: Calculating of gives us . This means that if is the correct number of students who prefer walking, then out of the surveyed students would have indicated walking as their preference.We need to repeat this process for each answer choice to see which one gives us a whole number when calculating the percentage of the surveyed students. If none of the answer choices result in a whole number, we would need to reassess our approach or get more information from the bar graph.For answer choice (B) , we calculate . Then, of is .Calculating of gives us . This means that if is the correct number of students who prefer walking, then out of the surveyed students would have indicated walking as their preference.For answer choice (C) , we calculate . Then, of is .Calculating of gives us . This means that if is the correct number of students who prefer walking, then out of the surveyed students would have indicated walking as their preference.For answer choice (D) , we calculate . Then, of is .Calculating of gives us . This means that if is the correct number of students who prefer walking, then out of the surveyed students would have indicated walking as their preference.Now, we need to determine which of these whole numbers (, , , ) could be represented on the bar graph. Since we don't have the bar graph, we cannot make a definitive conclusion. However, we can say that each of these answer choices could be possible if the corresponding number of students from the survey preferred walking.Without the bar graph, we cannot proceed further. We need the actual data from the graph to determine the correct answer. Since we cannot do that, we must end the solution process here.
